Severe Weather Live Tracking The storm I have decided to track is spread across four different states. The watch was announced June 1st, 2010 at 6:25pm and ended at June 2nd, 2010 at 2:00am. The location is name by different states Southeast and East Central Iowa Extreme Northwest and West Central Illinois Extreme Northeast Kansas Northern Missouri Description of the Storm Thunderstorm wind gusts to 70 MPH and Dangerous Lighning are possible in these areas. Hail up to 2 inches in diameter is possible in these areas. Source: Storm Prediction Center = http://www.spc.noaa.gov/products/watch/ww0242.html
|
||||
 This picture is from the Storm Prediction Center on June 1st, 2010 at 10:40pm. It is a watch picture for a severe thunderstorm. This picture shows severe wind and hail. The area could possibly experience moderate levels of wind with 65 knots plus, also 2" plus hail and tornadoes. The blue outline is where the watch has been issued. 2" hail is intense, I could not image that falling from this sky. Source: Storm Prediction Center = http://www.spc.noaa.gov/products/watch/ww0242.html |
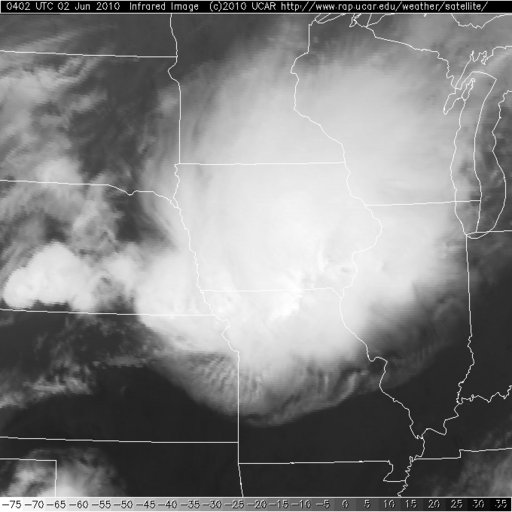 This is a infrared picture of the same watch storm at the same time from the National Center for Atmospheric Research. I am tracking this storm at night. So infrared is needed to see the storm. This is showing a very large bright white cloud. This means that this cloud is reaching the top of the atmosphere possibly 40,000ft+, also that the cloud is very cold. You can see blow up cloud starting just west of this. These will more than likely become severe thunderstorms also. I wish I had a visible satellite image with this to compare the what is going on with this thunderstorm. With a cloud this large and winds reaching 65 knots it is very possible to get large hail. If you notice that this middle of the cloud is extremely white and then you look at the Storm Prediciton Center's watch picture to the left is red where the extreme white is. Source: National Center for Atmospheric Research |
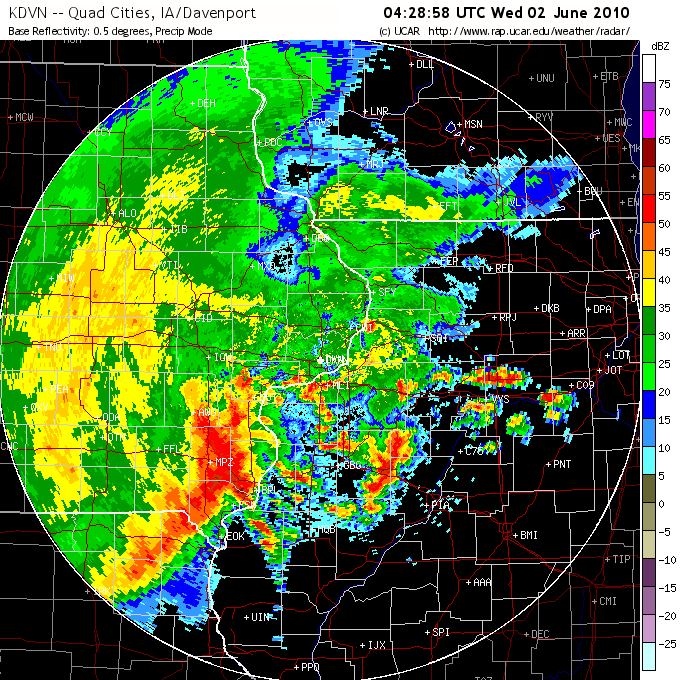 This is a picture of the same storm at the same time in Doppler from the National Center for Atmospheric Research. The doppler mode is in Precipitation. This picture is focused on eastern central Iowa. I tried to get the whole storm, but it was either this or the whole country. This shows you the intensity of the precipitation falling in the area. IF you look to the infrared picture in the middle you notice extreme white in eastern Iowa, which is where the red in this picture. This is the most intense part of this part of the storm. Remember this storm could possible create 65 knot winds with 2" plus hail. So as I am typing this hail that size could be falling in communities with cars, cattle, machinery, people. houses, buildings or anything outside could be getting pounded by large hail and extreme winds. So crazy and cool. Source: National Center for Atmospheric Research |
||